



Direct correlation between UI quality and conversion metrics
High-quality user interface design services directly influence financial performance by streamlining the path from landing page arrival to final transaction. When a platform features a clear, responsive, and logically structured interface, users experience fewer cognitive hurdles, which manifests as a measurable increase in conversion rates.
Data from A/B testing platforms like Optimizely or VWO consistently demonstrate that even minor adjustments to call-to-action placement, button contrast, and form field density can lead to double-digit percentage improvements in lead capture.
Reducing user friction to lower acquisition costs
Intuitive design functions as a primary lever for optimizing Customer Acquisition Cost (CAC). When a user interface is poorly constructed, potential customers encounter friction points such as confusing navigation, slow-loading elements, or ambiguous error messages that force them to abandon the funnel. Every percentage point of drop-off represents wasted marketing spend, as the cost to drive that traffic remains constant regardless of whether the user completes the action.
Professional design services mitigate this by implementing standardized interaction patterns that users recognize instinctively. For example, replacing a multi-step, text-heavy registration process with a streamlined, progress-bar-enabled interface often results in higher completion rates. By reducing the time-to-value, companies ensure that more of their paid traffic converts into revenue-generating users.
This efficiency allows firms to scale their marketing budgets more effectively, as the improved conversion rate offsets the rising costs of digital advertising inventory on platforms like Google Ads or Meta. Effective UI design also reduces the burden on customer support teams. When a product interface is self-explanatory, the volume of support tickets related to ‘how-to’ questions or navigation errors decreases. This shift lowers operational overhead, allowing resources to be reallocated toward product development or market expansion rather than reactive troubleshooting.
Cost structures of professional user interface design services
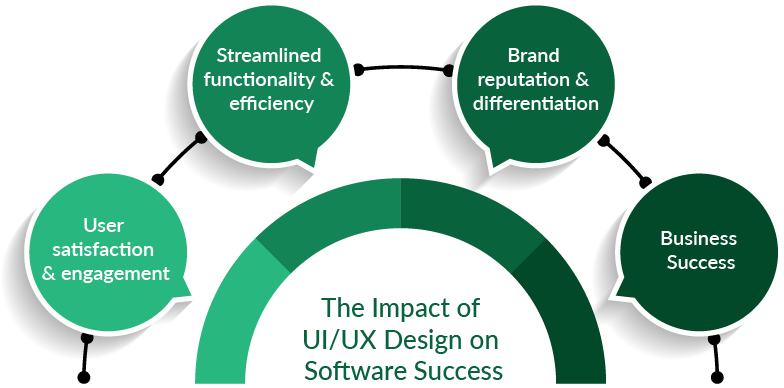
Professional design agencies year after year continue to refine their billing frameworks to manage project costs. Understanding these structures is essential for aligning your financial projections with the actual delivery of high-fidelity prototypes and design systems. Most firms base their pricing on a combination of team seniority, project complexity, and the depth of the required user research phase.
Fixed-bid versus time-and-materials engagement models
Choosing between a fixed-bid and a time-and-materials (T&M) model shifts the burden of risk between the client and the service provider. In a fixed-bid arrangement, the agency provides a set price for a defined scope of work. This model offers high budget predictability, making it ideal for projects with rigid requirements and clear deliverables.
However, it often includes a significant risk premium frequently 15% to 25% of the total cost to account for potential scope creep or unforeseen technical constraints. Conversely, the time-and-materials model charges for the actual hours logged by designers, researchers, and project managers. This structure provides maximum flexibility, allowing for iterative changes and pivots based on real-time user testing data.
While it avoids the risk premium associated with fixed contracts, it requires strict internal oversight to prevent budget overruns. Organizations often prefer T&M for complex, multi-phase product development where the final UI requirements evolve as the product matures.
Hidden variables in design pricing
Beyond the base hourly or project rate, several factors can inflate the total cost of user interface design services. Licensing fees for specialized design software, stock assets, or proprietary font families are often passed directly to the client. Furthermore, the cost of recruiting participants for usability testing sessions is frequently billed as a separate line item.
When evaluating proposals, ensure the contract explicitly states whether these auxiliary costs are included in the quoted price or if they will be billed as additional expenses. Transparent agencies will provide a detailed breakdown of these costs during the discovery phase, allowing for more accurate long-term financial planning.
Calculating the ROI of design-led product improvements
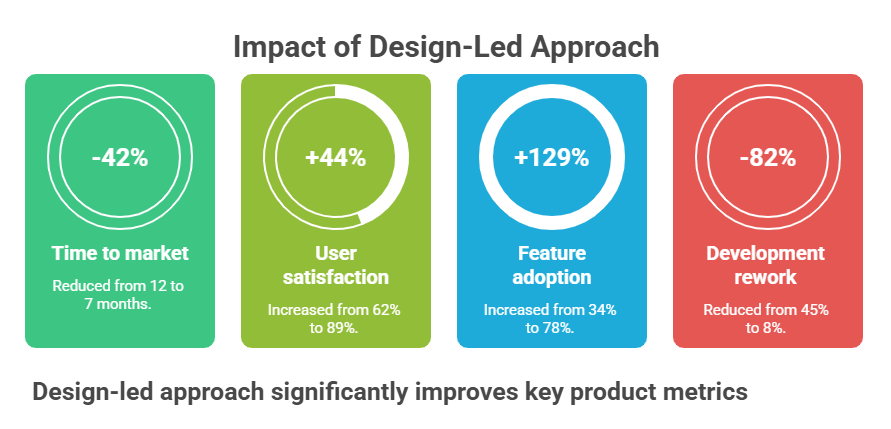
Investing in professional user interface design services requires a clear financial justification beyond aesthetic upgrades. To measure return on investment, organizations must track how specific UI modifications influence user behavior and operational costs. A design-led approach should correlate directly with increased conversion rates, reduced churn, and lower customer acquisition costs (CAC).
Key performance indicators for design success
To quantify the value of interface improvements, product teams should focus on measurable behavioral data rather than subjective feedback. The following metrics provide a baseline for evaluating the effectiveness of design interventions:
- Task Success Rate: This measures the percentage of users who successfully complete a core action, such as executing a trade or updating account settings, without encountering errors. A higher success rate directly correlates with improved retention.
- Time-on-Task: Efficiency gains are often reflected here. If a redesign reduces the time required to complete a complex workflow, the interface is effectively reducing friction, which allows users to engage more deeply with the platform.
- Support Ticket Reduction: High-quality UI design anticipates user needs, effectively acting as self-service documentation. A measurable decrease in support tickets related to navigation or feature discovery serves as a direct proxy for cost savings in customer service operations.
- Conversion Rate Optimization (CRO): By A/B testing specific UI components—such as call-to-action placement or form field simplification—teams can isolate the revenue impact of design changes.
When evaluating design partners, request case studies that explicitly link these metrics to financial outcomes. For instance, a firm that claims to improve user experience should demonstrate how a specific change in the navigation architecture led to a measurable increase in the ‘add-to-portfolio’ rate. Without these data points, it is impossible to distinguish between superficial visual updates and high-impact functional design improvements that drive long-term platform growth.
Hidden operational costs of poor interface design
Investing in professional user interface design services is often misclassified as a purely aesthetic expense. In reality, a poorly optimized interface functions as a recurring operational tax. When navigation is non-intuitive or workflows are fragmented, the friction manifests as tangible financial leakage across multiple departments.
The cost of customer support and onboarding
Design flaws force an artificial inflation of your customer success headcount. When users cannot intuitively locate a feature or understand a process, they generate support tickets. Each ticket represents a direct labor cost. If your interface requires a 30-minute guided walkthrough for basic tasks, your onboarding costs are essentially doubled compared to a platform that facilitates self-service adoption.
Consider the following operational impacts of subpar design:
- Ticket Volume Spikes: Interfaces that lack clear feedback loops or status indicators lead to repetitive ‘Where is my order?’ or ‘How do I export this?’ inquiries. A 20% increase in support volume often necessitates hiring additional staff or paying for extended support hours.
- Increased Training Overhead: For B2B platforms, poor UI design forces your team to spend more time training clients. This reduces the capacity of your account managers to focus on upsell opportunities or relationship management.
- High Churn Rates: Users who struggle with a platform’s interface during the first 48 hours are significantly more likely to abandon the service. The cost of acquiring a new customer is far higher than the cost of retaining an existing one, making churn a critical financial metric tied directly to interface quality.
By shifting budget toward robust user interface design services, companies often see a measurable reduction in support ticket volume within the first quarter of deployment. This is not merely about making a site look modern; it is about automating the user experience so that your human capital can focus on high-value tasks rather than explaining basic navigation. Calculating the total cost of ownership for your software must include these hidden support expenses, as they frequently eclipse the initial investment in design and development.
Strategic trade-offs in design investment
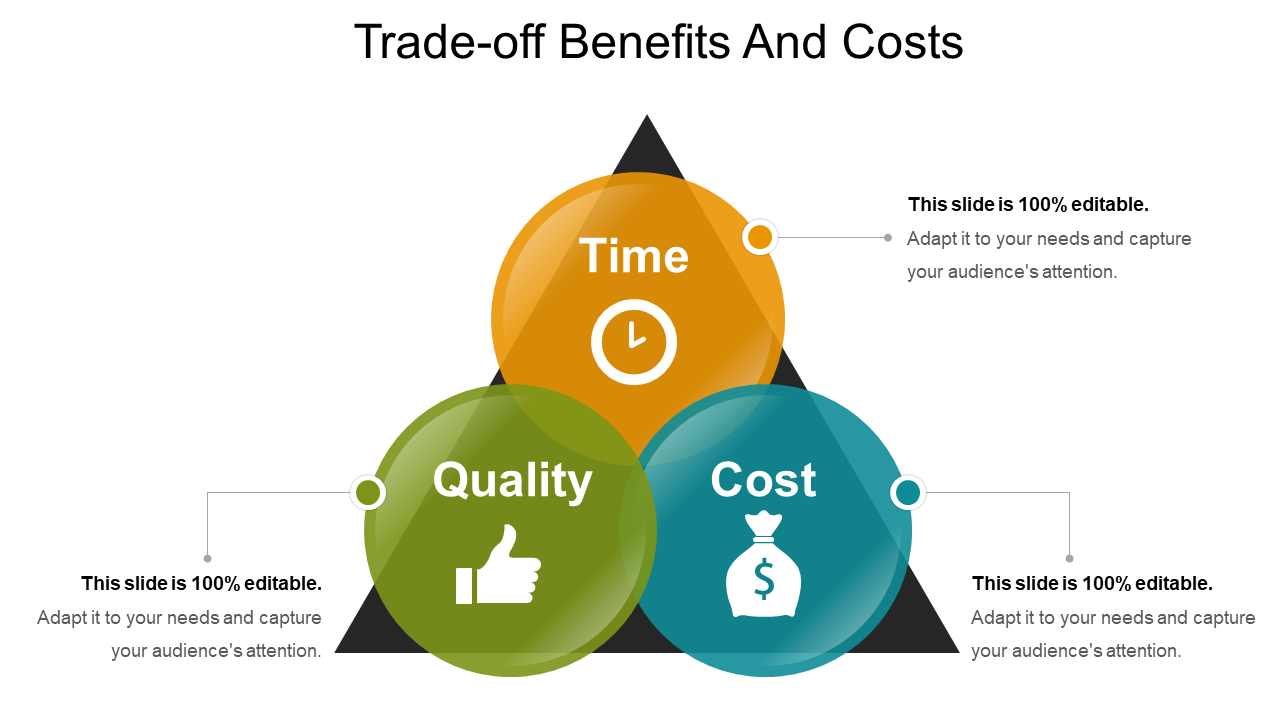
Allocating capital toward user interface design services requires balancing immediate functional requirements against long-term scalability. Organizations often face a choice between rapid prototyping to capture market share and building a robust, modular design system that reduces technical debt. High-quality interface design is not merely aesthetic; it serves as a mechanism to lower customer acquisition costs and decrease support overhead by reducing user friction.
Prioritizing high-impact interface components
To maximize return on investment, firms should adopt a weighted scoring model for design tasks. Focus resources on components that directly influence the conversion funnel or core product utility. By mapping interface elements against user journey data, teams can identify which screens generate the highest abandonment rates and prioritize those for professional redesign.
Consider these three categories when allocating your design budget:
- High-Impact Conversion Points: Checkout flows, sign-up modals, and primary call-to-action buttons. These require custom, high-fidelity design attention to ensure optimal conversion rates.
- Utility-Driven Components: Data dashboards, settings menus, and navigation structures. These benefit from standardized, reusable patterns that prioritize clarity and information density over visual flair.
- Support-Reducing Elements: Error states, onboarding tooltips, and empty states. Investing in these areas minimizes the need for customer support intervention, providing a clear, measurable reduction in operational costs.
When selecting external user interface design services, evaluate providers based on their ability to deliver a scalable design system rather than isolated page mockups. A provider that delivers a component library—complete with documentation, tokenized design variables, and accessibility compliance—offers significantly higher long-term value. This approach ensures that future iterations require less engineering effort, effectively lowering the total cost of ownership for the product’s interface.
Frequently Asked Questions
Methodology for calculating the ROI of user interface design services
ROI is calculated by measuring the increase in conversion rates, reduction in customer support tickets, and improved user retention against the total cost of the design engagement. Use the formula: (Net Profit from Design Improvements – Cost of Services) / Cost of Services.
Metrics indicating that design services are providing value
Key performance indicators include a decrease in bounce rates, higher task completion rates, reduced time-to-onboarding for new users, and a measurable decrease in support requests related to usability. If you are looking for a b2b ux design agency to help with these metrics, ensure they are familiar with the latest web design trends and have a track record of working with design agencies leading the industry in conversion optimization.


